What wearables actually measure
Almost every consumer wearable sold today is built on the same two sensors: a PPG (photoplethysmography) optical heart-rate module and a three-axis accelerometer. Everything else — sleep stages, recovery scores, stress, "readiness" — is derived. The hardware is honest. The marketing layered on top of it is where the slippage happens.
PPG works by shining green (and increasingly red and infrared) LEDs into capillary beds and measuring the reflected signal. From that waveform a device estimates heart rate, inter-beat interval, and HRV (heart-rate variability). It does not directly measure oxygen saturation, stress, sleep stage, or "strain." Those are model outputs, not measurements, and they inherit the model's assumptions.
That distinction matters because validation studies treat each output separately. A device can be excellent at total sleep time and mediocre at sleep staging in the same wear-night. Chinoy and colleagues compared seven consumer devices against polysomnography and found that most performed acceptably for sleep duration and worse for stage identification, particularly REM [Chinoy 2021]. Read your device output through that filter.
The honest framing: wearables are excellent at trend, decent at averages over weeks, and weak at single-night absolute values. Treat the rolling 14- to 30-day baseline as the signal. Treat any single morning readout as noise unless it's part of a streak.
Oura, WHOOP, Apple Watch — what each is good at
Oura (now on Gen 4) is a ring form factor optimized for sleep and overnight metrics. Independent validations have found Oura's total sleep time and resting heart rate track reasonably well against polysomnography and ECG in adults, with sleep-stage agreement that improves on early-generation models but still trails clinical standards [de Zambotti 2019]. The strength: passive, comfortable, long battery, strong overnight signal.
WHOOP is wrist-band only, subscription-based, and oriented toward athletes. Its "strain" and "recovery" scores are proprietary composites built largely from HRV and resting heart rate. The underlying cardiovascular signals are well-validated; the scoring layer is opaque. Useful if you respect the rolling baseline and ignore the single-day percentile.
Apple Watch is the broadest-purpose device. ECG, FDA-cleared atrial-fibrillation notifications, fall detection, and an open API that third-party apps build on. Sleep is a weaker output relative to Oura, and battery life forces a charging window that competes with overnight wear. The trade is breadth over depth.
Garmin and Polar belong in this conversation for endurance athletes — their chest-strap ecosystems still produce the cleanest cardiac signals available to consumers. Wrist-based PPG remains noisier than a chest strap during exercise, especially at higher intensities, and the literature is fairly settled on that point.
Buy the device whose strongest output matches the question you're actually trying to answer. Most people buy on aesthetic and then look for the question afterward.
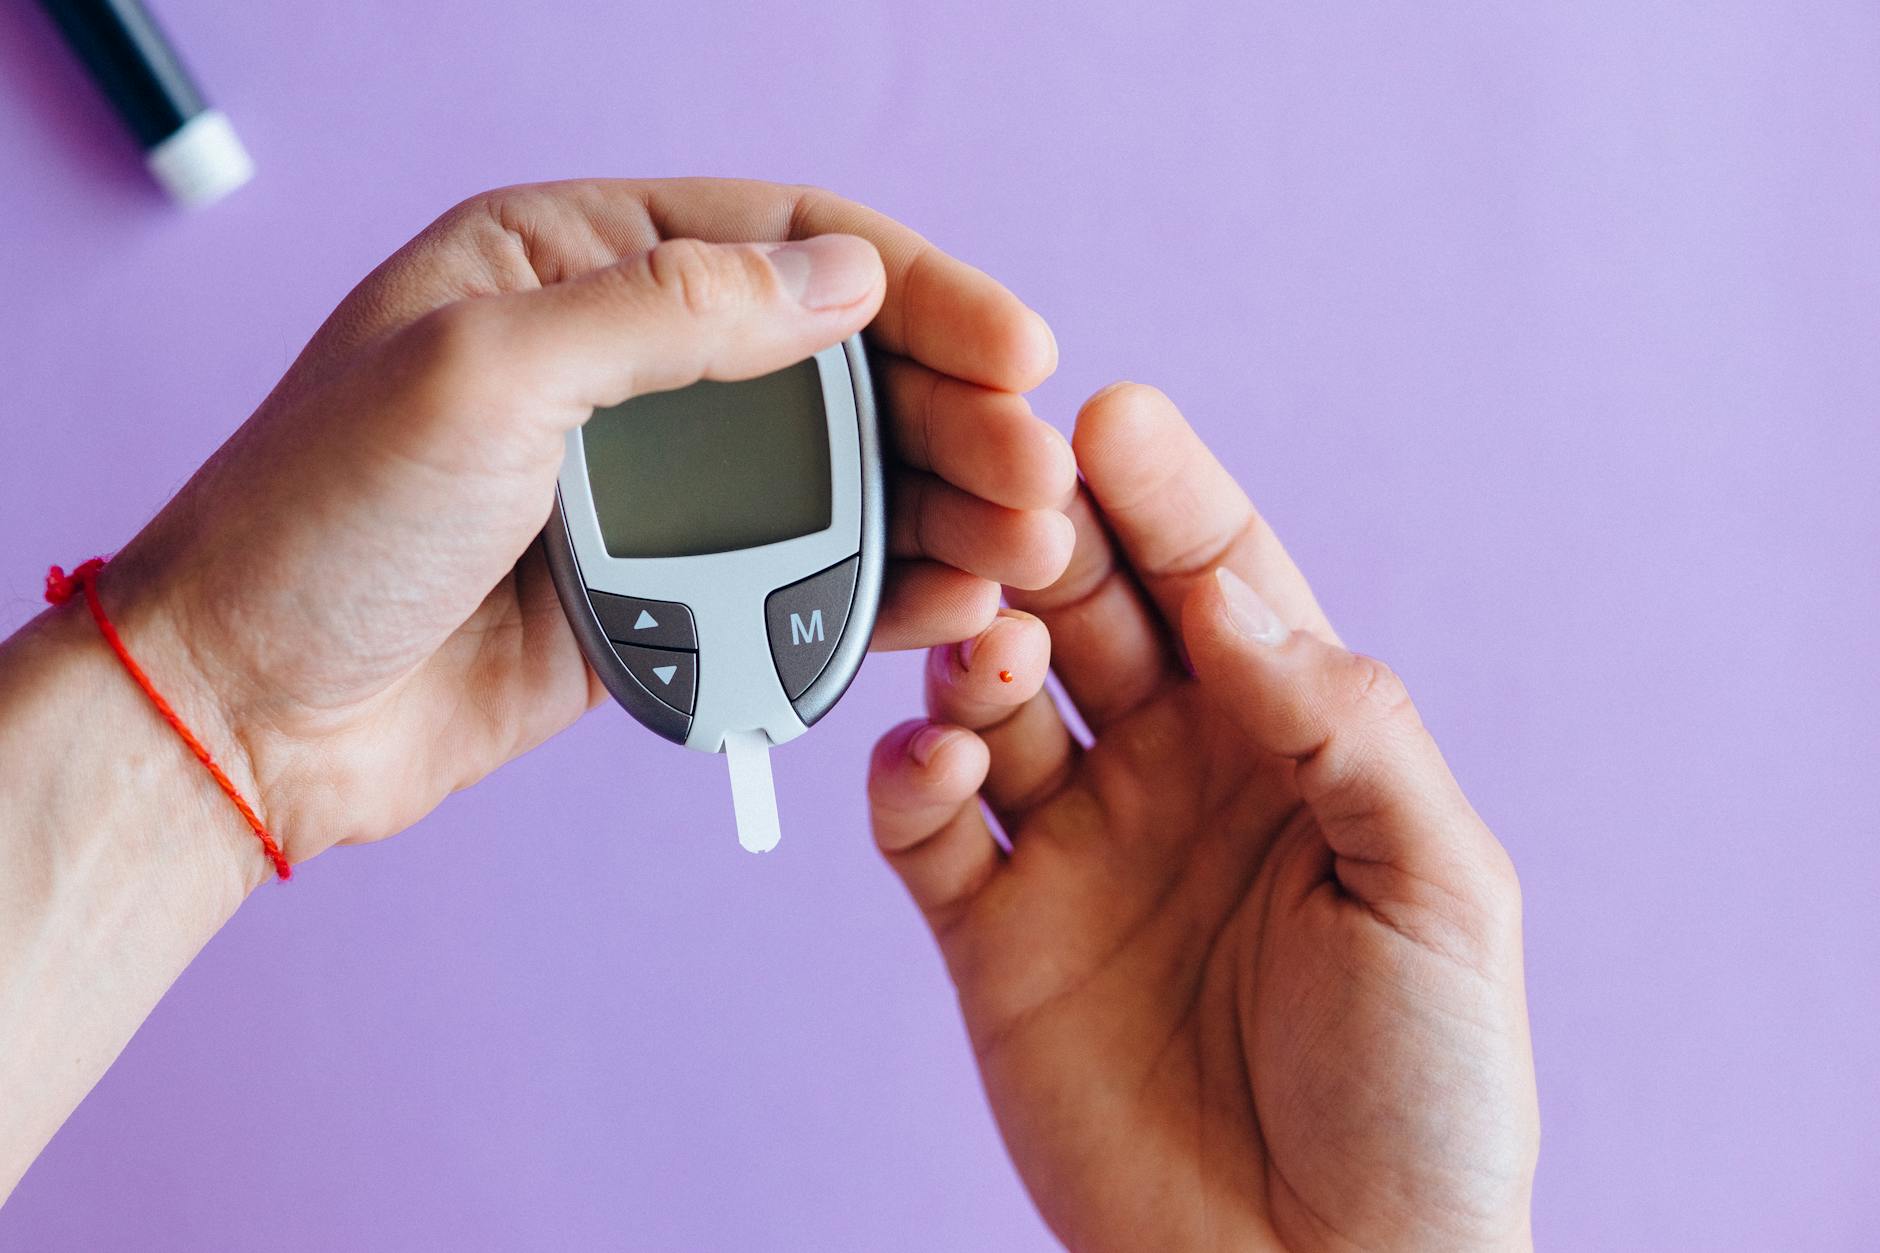
Continuous glucose monitors for non-diabetics — Levels, Stelo, Dexcom
CGMs (continuous glucose monitors) measure interstitial glucose every one to five minutes via a small subcutaneous filament. Originally developed for type 1 diabetes, they've moved into the consumer space through Dexcom Stelo, Abbott Lingo, and software wrappers like Levels that overlay coaching on the raw Dexcom or Libre signal.
What's real: postprandial glucose excursions vary widely between individuals eating the same meal. Zeevi and colleagues showed this decisively in the PREDICT/Personalized Nutrition work — the same banana can move glucose modestly in one person and substantially in another [Zeevi 2015]. That biological variation is a legitimate use case for a two-week CGM trial.
What's overstated: that glucose variability in metabolically healthy adults predicts long-term health outcomes. The strongest mortality data sits with HbA1c (glycated hemoglobin) and fasting glucose, not with day-to-day excursion amplitude in normoglycemic people. The evidence that flattening a postprandial spike in a non-diabetic adult translates to durable health gains is thin. Reasonable editorial reads include Spector and colleagues' coverage of the PREDICT data and Patrick Mahinge's clinical reviews.
Where I land: a CGM is a useful 14-day experiment, especially for adults with prediabetes, metabolic syndrome, or PCOS (polycystic ovary syndrome), where individualized response data can plausibly guide carbohydrate choices. As a chronic consumer product for otherwise healthy adults, it tends to manufacture anxiety more reliably than it manufactures behavior change.
HRV trackers and the autonomic story
HRV is the beat-to-beat variation in cardiac timing, driven primarily by parasympathetic (vagal) tone. Higher HRV at rest generally tracks with cardiorespiratory fitness and recovery; falling HRV often precedes acute illness, training overreach, or accumulated stress. The Task Force standards [Malik 1996] remain the reference for measurement methodology.
Two practical points. First, optical HRV from a wrist or ring is noticeably less accurate than chest-strap or finger-clip ECG-derived HRV — particularly during movement. For research-grade morning baselines, a Polar H10 paired with HRV4Training is still the cleanest consumer-accessible option. Second, the absolute number is far less useful than your personal rolling average and the deviation from it.
Plews and colleagues showed that day-to-day HRV is too noisy to guide individual training decisions; the seven-day rolling mean is the unit of analysis that actually correlates with adaptation [Plews 2013]. Most consumer apps now default to a rolling baseline for that reason.
Red-light therapy and photobiomodulation — what's the evidence
Photobiomodulation (PBM), often sold as red-light therapy, uses red (roughly 630–680 nm) and near-infrared (810–850 nm) wavelengths to irradiate skin or deeper tissue. The proposed mechanism centers on cytochrome c oxidase in the mitochondrial electron transport chain. The evidence base ranges from solid in dermatology to thinner elsewhere.
Strongest data: skin (collagen induction, modest wrinkle reduction) and acute musculoskeletal recovery after eccentric exercise [Hamblin 2017]. Reasonable data: hair regrowth in androgenetic alopecia, certain wound-healing contexts. Weaker data: systemic metabolic effects, sleep, hormonal optimization. Most of the latter claims are mechanistic extrapolations, not outcome trials.
The buying decision usually comes down to irradiance and treatment time, not brand. Irradiance below roughly 30 mW/cm² at the target distance falls into ranges that aren't well-supported by the muscle and dermatology literature. Cheap panels often under-deliver here; many of the cosmetic LED masks sit even lower.
Body-composition tools — DEXA, BIA, calipers
DEXA (dual-energy X-ray absorptiometry) is the closest thing to a gold-standard body-composition measurement available outside a research lab — accurate for fat mass, lean mass, and regional distribution, with bone mineral density as a bonus output. A scan runs $40–$150 depending on city, and two scans a year is enough to track meaningful change.
BIA (bioelectrical impedance analysis) devices — InBody, withings scales, handheld units — estimate composition from electrical resistance through tissue. Hydration state, recent meals, and recent exercise all move the read meaningfully. Used consistently (same time of day, same fed/fasted state), BIA tracks trends acceptably. Used inconsistently, it generates noise dressed up as data.
Skin-fold calipers, in trained hands, sit closer to DEXA than to consumer BIA on the accuracy curve. The problem is "trained hands." For self-tracking, the realistic stack is one DEXA scan as a baseline and a consistent BIA or scale measurement for week-to-week trend.
Pick the single output you'd actually change behavior on — usually sleep duration, resting heart rate, or weekly active minutes — and buy the cheapest validated device that measures it well. An Apple Watch SE or a basic Garmin covers most adults.
Oura or comparable ring for overnight metrics, a chest strap for training HRV and zone work, and one DEXA scan a year for body composition and bone density. This stack covers the evidence-supported outputs without subscription creep.
Add periodic two-week CGM trials (Stelo, Lingo), a validated home BP cuff, an at-home VO2max test, and quarterly DEXA. Useful for genuine data nerds; diminishing returns once the rolling baseline is stable and the lab work is unremarkable.
How to think about the device stack
The honest hierarchy: the device is downstream of the question. "How well did I sleep this week?" is answered well by any modern ring or watch. "Am I overreaching in training?" is answered by HRV trend plus subjective recovery, not a single-day score. "Is my glucose response to oats unusual for me?" is answered by a 14-day CGM trial, not by a chronic subscription. "Am I gaining muscle?" is answered by DEXA bracketed by consistent BIA, not by a bathroom scale.
The failure mode common to almost all device buyers is collecting data they don't act on. A CGM that never changes a meal, an HRV score that never changes a training day, a sleep ring that never changes a bedtime — these are aesthetic purchases, not behavioral tools. The device is only worth the spend if a specific number is going to move a specific decision.
Second failure mode: chasing single-day deltas. HRV down 12 ms one morning means very little. HRV trending down 8 ms across two weeks while sleep efficiency drops means a real signal. Almost all consumer health-tracking literature points to rolling averages as the analytic unit.
Wearables are most valuable when they're boring — long-running baselines on a few honest outputs, used to change behavior at the edges. They're least valuable when they're exciting — flashy daily scores, percentile rankings, and proprietary "recovery" composites that obscure the underlying physiology.
- [Chinoy 2021] Chinoy ED, et al. Performance of seven consumer sleep-tracking devices compared with polysomnography. Sleep. 2021;44(5):zsaa291.
- [de Zambotti 2019] de Zambotti M, et al. The sleep of the ring: comparison of the OURA sleep tracker against polysomnography. Behav Sleep Med. 2019;17(2):124-136.
- [Zeevi 2015] Zeevi D, et al. Personalized nutrition by prediction of glycemic responses. Cell. 2015;163(5):1079-1094.
- [Malik 1996] Task Force of the European Society of Cardiology and the North American Society of Pacing and Electrophysiology. Heart rate variability: standards of measurement, physiological interpretation, and clinical use. Circulation. 1996;93(5):1043-1065.
- [Plews 2013] Plews DJ, et al. Training adaptation and heart rate variability in elite endurance athletes. Eur J Appl Physiol. 2013;113(7):1729-1741.
- [Hamblin 2017] Hamblin MR. Mechanisms and applications of the anti-inflammatory effects of photobiomodulation. AIMS Biophys. 2017;4(3):337-361.
- [Bent 2020] Bent B, et al. Investigating sources of inaccuracy in wearable optical heart rate sensors. NPJ Digit Med. 2020;3:18.
- [Shapiro 2021] Shapiro A, et al. Glucose variability in healthy adults: clinical relevance and measurement. Diabetes Technol Ther. 2021;23(S3):S5-S15.